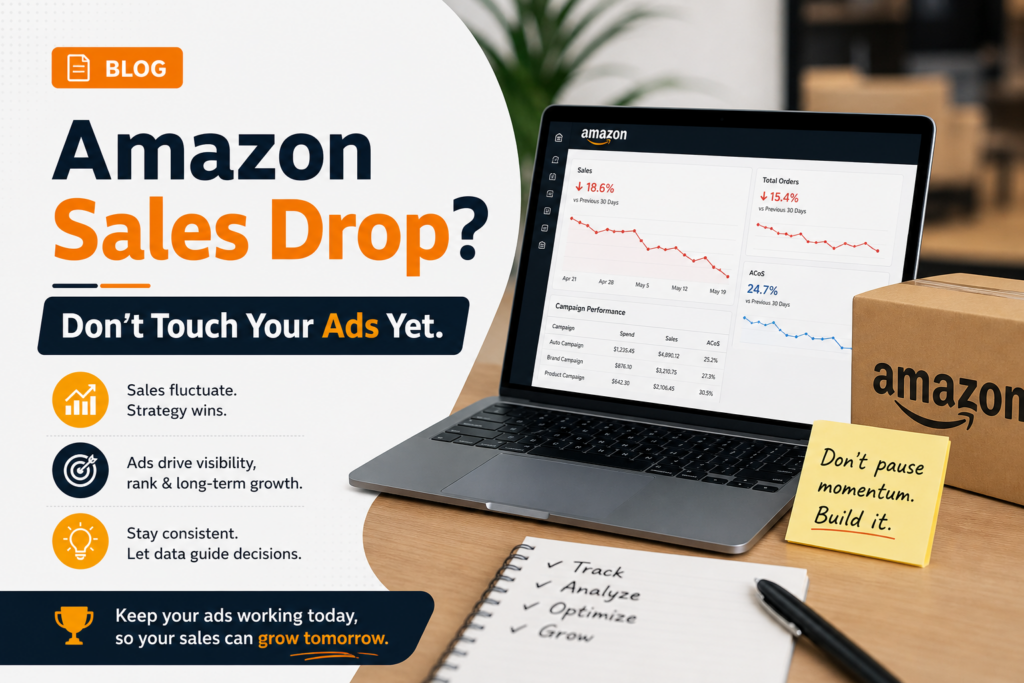
You woke up. Opened Seller Central. Sales are down — again. Your first instinct is to go into your campaigns and start changing bids, pausing keywords, restructuring targeting.
Stop. That might be exactly the wrong move.
Most sellers lose even more money by optimizing their ads when the actual problem has nothing to do with ads. A slipping Buy Box, a ranking drop on three core keywords, or a budget that runs dry at noon — any of these will kill your sales just as effectively as a bad campaign.
Before you change a single bid, work through this checklist. It takes less than 30 minutes, and it will show you exactly where to put your energy. This is the same diagnostic process we use at HitsValue as an Amazon marketing company in India when a client account first flags a sales dip.
This is the first thing to check, every single time. The Buy Box controls who gets the order when a customer clicks Add to Cart. If you are not winning it, traffic arriving at your listing quietly goes to someone else. You will see sessions holding steady but conversions dropping — and wonder why your ads look fine.
What to look for
Where to check: Seller Central → Reports → Business Reports → Detail Page Sales and Traffic by Child Item
The column: “Buy Box Percentage” — how often your listing owned the Buy Box during the period
What to compare: Pull the same metric from 30 days ago. Even a drop from 95% to 75% is significant.
A Buy Box percentage below 85% on your main SKUs is worth investigating before anything else.
Why it slips without warning
- A competitor wins the Featured Offer by slightly undercutting your price
- Your account receives a policy warning, which can suppress Buy Box eligibility
- A reseller of your own product appears and prices lower
- Your FBA inventory runs critically low and Amazon temporarily removes your Buy Box
We monitor Buy Box percentage weekly for every client account. A single SKU losing the Buy Box for four days is enough to noticeably move monthly revenue — especially in competitive categories like supplements or electronics accessories.
Paid ads drive traffic. Organic rank drives long-term profitability. When organic rank slips on your top two or three keywords, you lose visibility that ads cannot fully replace — because organic results compound impressions alongside sponsored placements.
What to look for
Where to check: Helium 10 Keyword Tracker, DataDive, or manual ASIN searches with keyword tracking enabled
Which keywords: Your top 5–10 highest-conversion search terms from the Search Term Report — not just volume leaders
What to compare: Current rank vs. 14 days ago and 30 days ago
A drop from page one to page two for a high-converting keyword can reduce organic-driven orders by 40–60% on that term alone.
What causes organic rank to fall
- Session velocity decreasing — fewer clicks signals lower relevance to Amazon’s algorithm
- Conversion rate dropping — visits without purchases push your rank down
- A competitor receiving a surge of external traffic or sales velocity
- A listing content change that reduced your keyword indexing coverage
Here is something that confuses sellers: clicks can stay flat or even increase while orders fall. That is almost always a listing problem. Something about the page itself is causing people to leave without buying.
What to look for
Where to check: Seller Central Business Reports — “Unit Session Percentage” is your conversion rate
Benchmark: Category average is 10–15%. Below 8% on a product with decent reviews typically points to a listing issue
What changed recently: Images, bullet points, price? Even small changes move conversion significantly
Common conversion killers hiding in plain sight
- Main image doesn’t clearly show scale or use case — customers guess and leave
- Price crept up relative to comparable competing products
- Recent negative reviews pushed your average below 4.0
- Q&A section has unanswered questions about a common objection
- Your images look similar to competitors, giving customers no reason to pick you
A pet supplies brand we worked with saw sales fall 28% in three weeks with no change in ad spend or rank. The issue was a main image swap during a creative refresh — the new image was higher quality but made sizing unclear. Reverting the image recovered sales within nine days.
Sometimes the market simply moves. A keyword that drove strong volume in March may see 30–40% lower search volume by May — not because of anything you did, but because of seasonal patterns, trend cycles, or a competitor dominating a new product category.
What to look for
Where to check: Amazon Brand Analytics → Search Frequency Rank for your core terms. Also: Google Trends, Helium 10 Cerebro trend view
What to compare: Search frequency rank — current period vs. same period last year and vs. 60 days ago
Demand shifts that sellers often miss
- Seasonal cycles — outdoor, garden, and fitness categories follow predictable patterns easy to forget year to year
- A competitor ran an aggressive Lightning Deal that captured category attention
- A macro trend shifted consumer interest — home office products saw this dramatically post-2021
- Your category terminology shifted — customers started using a different search phrase for the same item
If search volume is genuinely down industry-wide, no amount of bid adjustment will fully offset that. Understanding this helps you make smarter decisions — riding out the cycle, investing in awareness-stage Sponsored Brands, or exploring adjacent keywords trending upward.
Amazon advertising auctions are dynamic. What you paid for a click in January may cost 35–50% more by Q4. If your bids haven’t changed but Cost Per Click has climbed — which happens when more competitors enter your category — your spend goes further toward traffic and less toward profitability.
What to look for
Where to check: Campaign Manager → Sponsored Products → Search Term Report. Filter top keywords and compare average CPC month over month
What to flag: Any keyword where CPC increased more than 20% over 60 days while conversion rate held flat or dropped
What CPC pressure does to your business
- Your ACoS climbs even if conversion rate is unchanged — each click simply costs more
- Your daily budget gets consumed faster, so you stop showing later in the day
- Margins compress — what was profitable at a lower CPC loses money when rates spike
We have seen categories where average CPCs increased 60% year-over-year with no corresponding increase in consumer demand. The sellers who stayed profitable diversified keyword coverage and improved listing conversion — not the ones who simply matched competitor bids.
This is straightforward to diagnose and often overlooked. If your campaigns run out of daily budget before the day ends, you go dark during whatever hours remain. For most categories, afternoon and evening are peak purchase hours. Running out of budget at 1pm means you miss the most valuable window.
What to look for
Where to check: Campaign Manager → select a campaign → Placement tab. Also check if campaigns show the yellow “Budget” label — that means they hit the cap
What to compare: Impression and click volume by hour. A sharp drop mid-day is the signal.
Why this gets worse without obvious signs
- Total daily spend looks fine — because the budget was fully used — but the timing is wrong
- You run efficiently in the morning when competition is lower, then go dark when buyer intent peaks
- Competitors with higher budgets capture your category’s highest-intent shoppers in the evening
This is the most overlooked structural risk in Amazon advertising. Most sellers rely on three to five keywords for the majority of their sales. That works until one of those terms shifts — in rank, demand, or competition — and suddenly your entire revenue picture changes.
What to look for
Where to check: Your Search Term Report — sort by orders, calculate what % of total orders come from your top 5 terms
The danger zone: More than 60% of orders tracing back to 3 or fewer search terms = high concentration risk
What happens over time
- A single ranking drop on your top term produces a revenue drop that looks like a business crisis but is a keyword dependency problem
- A competitor captures disproportionate share on your core term and you have no fallback
- Seasonal demand hits your core terms hard, with no other keywords to absorb the difference
When we audit new client accounts, keyword concentration is one of the first things we model. It tells us where the revenue fragility lives, and it shapes our entire content and campaign strategy for the first 90 days.
| # | What You Found | Fix This First — Before Touching Ads |
|---|---|---|
| 1 | Buy Box lost | Fix pricing, inventory, or reseller issue |
| 2 | Organic rank dropped | Improve conversion rate and session quality |
| 3 | Listing conversion fell | Audit images, price, and recent reviews |
| 4 | Demand shifted | Research adjacent keywords and seasonal patterns |
| 5 | CPC rose sharply | Refine keyword targeting, evaluate margin thresholds |
| 6 | Budget ran out mid-day | Restructure budget allocation or campaign scheduling |
| 7 | Term concentration high | Begin keyword expansion as medium-term priority |
Adjusting your ads without this checklist is like treating symptoms while the underlying issue goes unaddressed. It costs money and delays recovery.
HitsValue works with Amazon sellers across the US, UK, and India to diagnose performance drops, rebuild ad strategy, and grow sustainable revenue. Our free account audit covers all 7 areas in this guide.
Get Your Free Audit →